Debugging is a critical part of any software development process, but it can be a frustrating and time-consuming task. As a Node.js developer, you know that even the most minor bug can cause significant problems in your application’s performance and user experience. That’s why it’s essential to have a solid debugging process in place to catch and fix issues quickly.
Debugging Node.js applications requires a combination of technical expertise, problem-solving skills, and attention to detail. In this article, we’ll provide you with ten tips to debug Node.js applications like a pro. We’ll cover everything from using the right tools to writing effective code and best practices for troubleshooting issues.
Whether you’re a seasoned web developer or just getting started, node.js is a popular choice for server-side development. Hence, these tips will help you streamline your debugging process and ensure that your applications are performing at their best. From using a debugger like ndb to monitoring your application’s performance with PM2, you’ll learn everything you need to know to debug like a pro.
So if you’re tired of spending hours chasing down bugs in your Node.js applications, read on and discover how to debug like a pro.
Understanding the Node.js Debugger
Before we dive into the best practices and techniques to debug Node.js applications, it’s essential to understand the built-in debugger that comes with Node.js. The Node.js debugger allows you to pause the execution of your code and inspect the current state of your application. This can be incredibly useful for identifying issues and debugging your code.
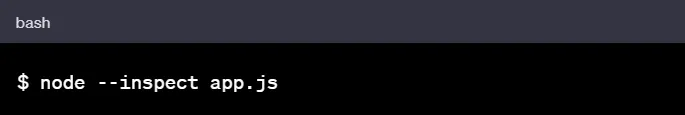
To use the Node.js debugger, you need to launch your Node.js application with the ‘–inspect’ flag. For example, if you want to debug a file named ‘app.js’, you can launch it with the following command:
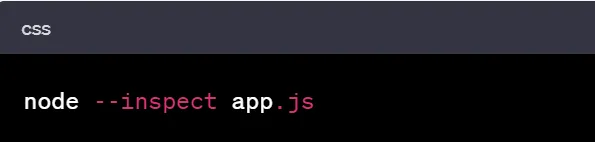
This will start your application and allow you to connect to the debugger using the Chrome DevTools. To do this, simply open Chrome and navigate to ‘chrome://inspect.’From here, you can select and start debugging node.js application.
Types of errors
“Debugging” is the name given to the various means of fixing software defects. Fixing a bug is often straightforward. Finding the cause of the bug can be considerably more complex and incur many hours of head-scratching. The following sections describe three general types of errors you will encounter.
- Syntax Errors:
Syntax errors are caused by improper adherence to the language’s rules. For instance, forgetting to close a bracket or misspelling a statement can lead to a syntax error.
Fortunately, using a good code editor can help catch these common mistakes:
- Colour-coding valid and invalid statements
- Type-checking variables
- Detecting unreachable code
Additionally, using a code linter like ESLint can catch syntax errors, bad indentation, and undeclared variables.
- Logic Errors:
Logic errors, on the other hand, occur when your code runs but the output is not what you expected. Examples of logic errors include failing to log out a user or saving data incorrectly to a database.
These errors are caused by
- Using the wrong variable
- Incorrect conditions
- Failing to account for operator precedence in your calculations
- Runtime errors:
Runtime errors are only revealed when your application is executed, leading to a crash. Runtime errors include dividing by
- A variable set to zero
- Attempting to access a non-existent array item.
Unfortunately, logic and runtime errors are more difficult to spot. However, techniques such as test-driven development, issue-tracking systems, and source control can help mitigate these errors.
By understanding these three types of errors and implementing appropriate techniques, you can minimize the number of errors you encounter while developing in Node.js.
Top 10 tips for debugging Node.js applications
- Use console.log() statements:
Adding console.log() statements to your code is a simple and effective way to track the flow of your application and identify issues.
For example:
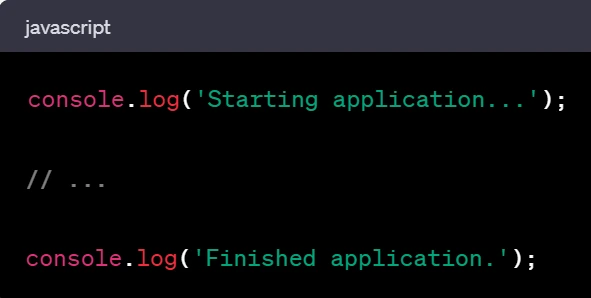
In this example, the ‘console.log()’ statements will print messages to the console, allowing you to track the flow of your application and identify any issues that occur.
- Use breakpoints:
Setting breakpoints in your code can help you pause the execution of your code at specific points and inspect the current state of your application.
For example:
In the following code, we’ve set a breakpoint on line 5 using the Node.js debugger:

When the debugger hits the breakpoint on line 5, it will pause the execution of the code and allow you to inspect the current state of your application.
- Check the logs:
Checking the logs generated by your application can help you identify any errors or issues that occur during runtime.
For example:
In the following code, we’re using ”Winston’ logging library to log messages to a file:
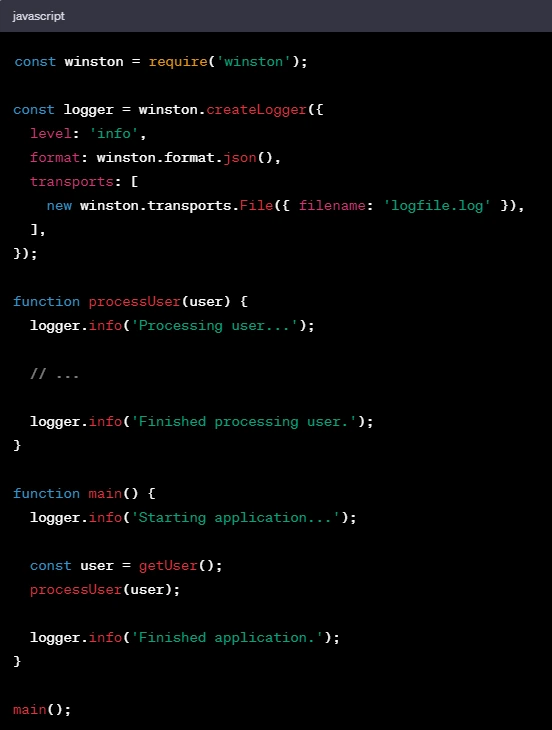
In this example, the Winston library is being used to log messages to a file called logfile.log. You can check this file to identify any errors or issues that occur during runtime.
- Review the stack trace:
When an error occurs, reviewing the stack trace can help you identify where the error occurred and what functions were called leading up to the error.
For example:
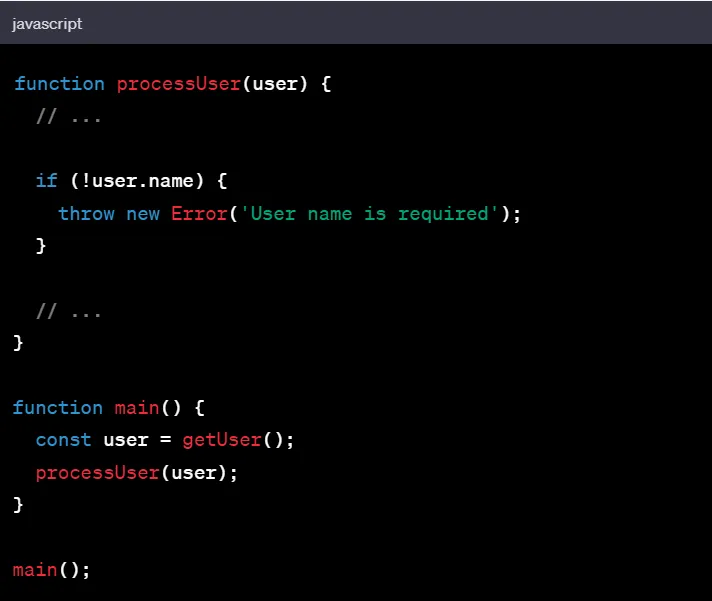
In the following code, we’re intentionally throwing an error to demonstrate how to review the stack trace:
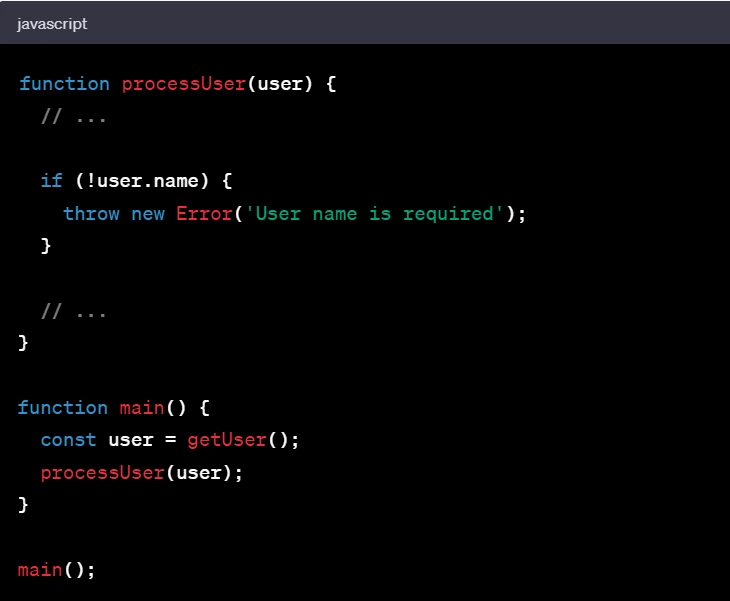
In this example, we’re throwing an error if the user.name property is not defined. If this error is thrown, the stack trace will show you where the error occurred and what functions were called leading up to the error.
- Test your code:
Writing automated tests for your code can help you catch issues before they occur in production.
For example:
In the following code, we’re using the mocha testing framework to write a test for the processUser function:
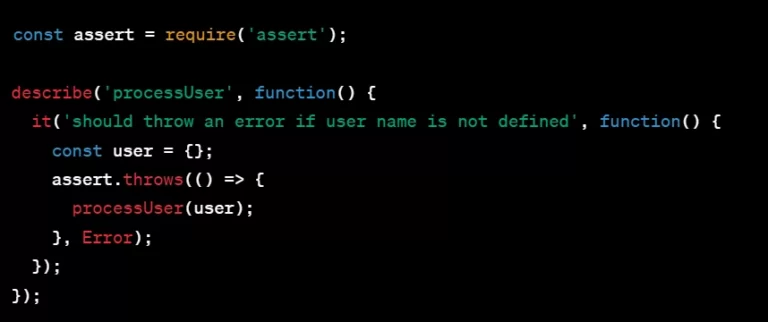
In this example, we’re testing that the processUser function throws an error if the user.name property is not defined. Running thistest using mocha will catch this issue before it occurs in production.
- Use a linter:
A linter can help you identify issues with your code before you even run it, such as syntax errors, unused variables, or other common mistakes.
For example:
In the following code, we’re using the eslint linter to identify issues with our code:
In this example, the eslint linter would identify that the getUser function is not defined and that the throw new Error() statement should be wrapped in a try-catch block.
- Check your dependencies:
Making sure you’re using the latest versions of your dependencies can help you avoid issues and vulnerabilities.
For example:
In the following code, we’re using the npm package manager to check for outdated dependencies:
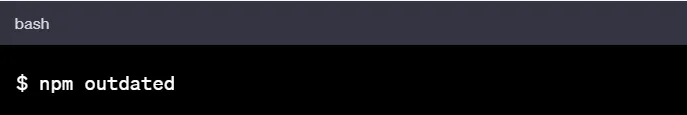
Running this command will show you which dependencies are outdated and need to be updated.
- Use a debugger:
Using a debugger like ndb can provide a more visual debugging experience and allow you to inspect variables and the call stack.
For example:
In the following code, we’re using ndb to debug our application:
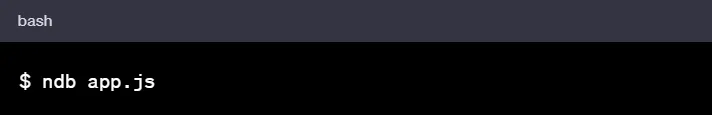
Running this command will launch the ndb debugger and allow you to set breakpoints, inspect variables, and step through your code.
- Use a profiler:
Using a profiler like node-inspector can help you identify performance bottlenecks in your code.
For example:
In the following code, we’re using node-inspector to profile our application:
Running this command will launch node-inspector and allow you to profile your application and identify performance issues.
- Use a monitoring tool:
Using a monitoring tool like PM2 can help you monitor your application’s health and performance in realtime.
For example:
In the following code, we’re using PM2 to monitor our application:
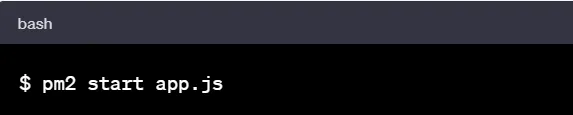
Running this command will start your application and allow you to monitor its health and performance in real-time using the pm2 command line interface.
Conclusion
In conclusion, debugging node.js applications is an essential part of software development, and identifying and fixing errors quickly is crucial to ensuring your code runs smoothly. You can streamline your development process and create more efficient, reliable applications by understanding the three types of errors you may encounter and implementing effective debugging techniques such as using a code editor, linter, and issue tracking system.
However, no matter how experienced a developer you are, bugs will always creep into your code. So, don’t be disheartened if you encounter an error or two. Instead, embrace the challenge and use your acquired knowledge and techniques to find and fix the issue. Remember, each bug you encounter and solve will make you a better developer.
Now that you better understand how to debug Node.js applications, it’s time to put this knowledge into practice. Start by reviewing your code for any syntax, logic, or runtime errors and use the debugging techniques discussed to solve them. With time and practice, you’ll become an expert at finding and fixing bugs, and your applications will run smoothly and efficiently.
Ready to take your Node.js development to the next level? Symentix is here to help. Our team of experienced developers can provide you with the support and guidance you need to tackle even the toughest Node.js challenges. Contact us today to learn more and start building better applications with Node.js.